Debugging is all about FINDING and FIXING
However, sometimes it's difficult for Web developers to find the errors in their scripts!! because of which it takes a lot of hours or days to actually fix the bug.
Looking for bugs > fixing them?
So how to get over with this snag?
Well, run your project on chrome
Just hit F12 on your keyboard to open the dev tools !!
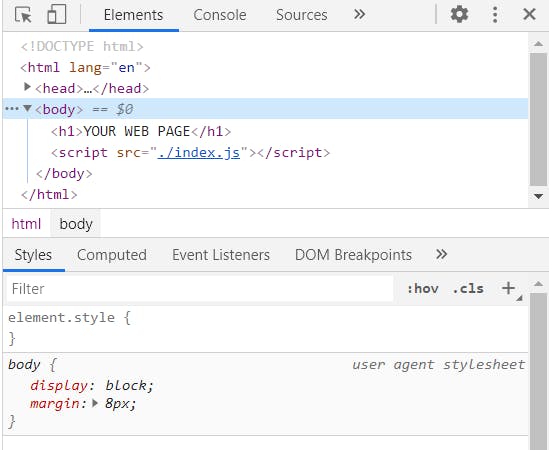
Most of the developers are familiar with devtools but only a few people are actually using this tool efficiently!!
2.Select the sources Panel from the dev tools.
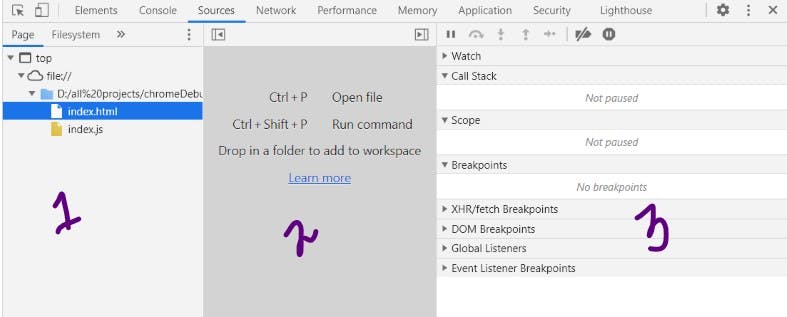
3.Select the file which you want to debug.
Welcome to debug pitch
You'll notice the source panel has 3 parts ( check the image above)
- File Navigator - source Files
- Code Editor
- JavaScript Debugging
In this article our focus will be on javascript debugging
The first step towards debugging is setting the BREAKPOINTS
Breakpoint is a point in a code where the debugger will automatically stop the js execution
While our execution is in pause state we can examine the variables and execute commands in console. All meant to say that we can debug the code till the breakpoint.
Lets understand this with better example
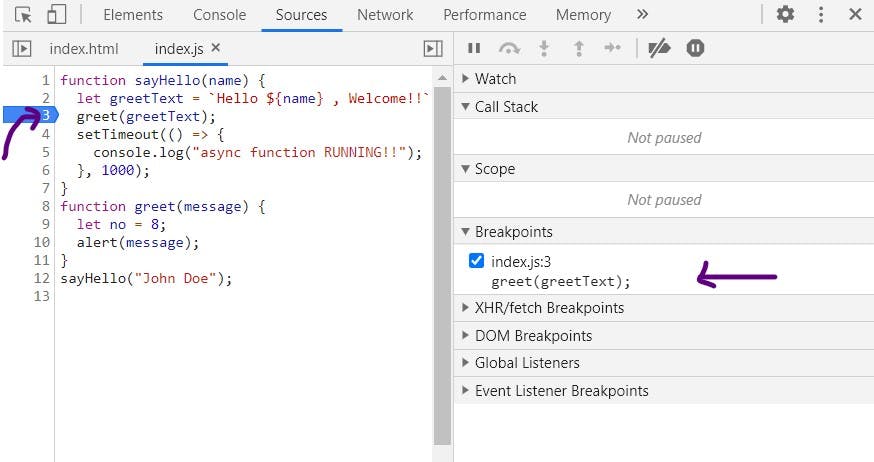
In index.js we have selected line 3 as a breakpoint in our code and also you can see it is mentioned in the breakpoints section on the right side of the page.
Now refresh the page to run the Javascript debugger.
After reloading the page, the debugger will pause the execution on the given breakpoint and also you'll notice some changes on the right side.
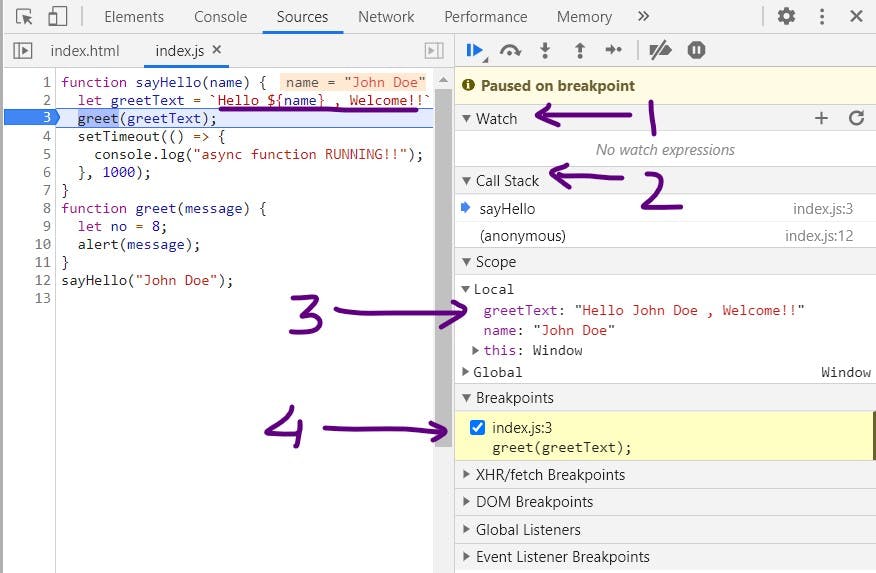
Achievement Unlocked!! , Three main sections which will help you to find the bug in meantime!
Let's explore each section one by one
1.Watch - (In this section you can input any expression and see the result at the same time by clicking the " + ")

2.Call Stack - (Here you can review the call stack and can examine the flow of calls in the scripts )

3.Scope - ( You can check the scope of each variable )

Now as soon as you found the bug you can focus more on fixing them !!
Happy Debugging!!
